Clustering area - get center location
geospatial
map
Clustering
Dataset
Load dataset
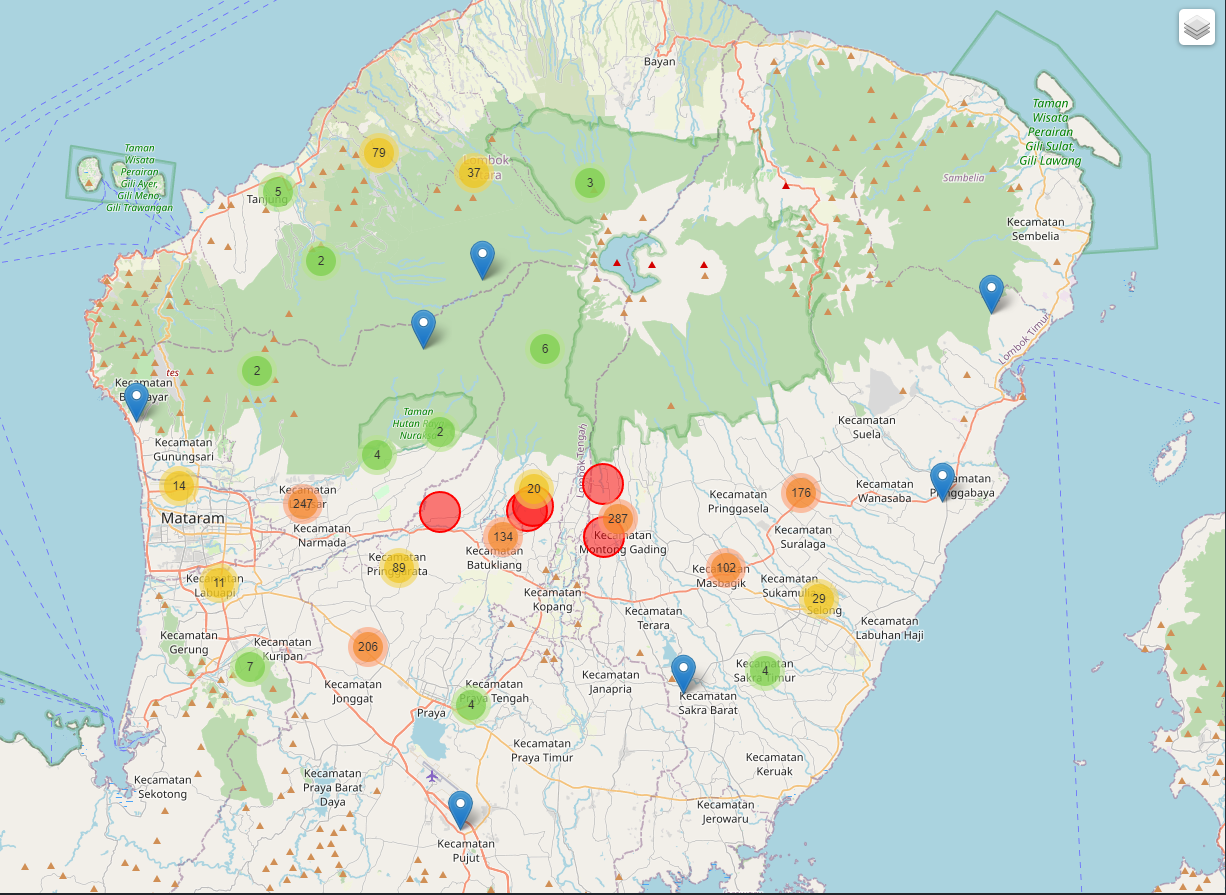
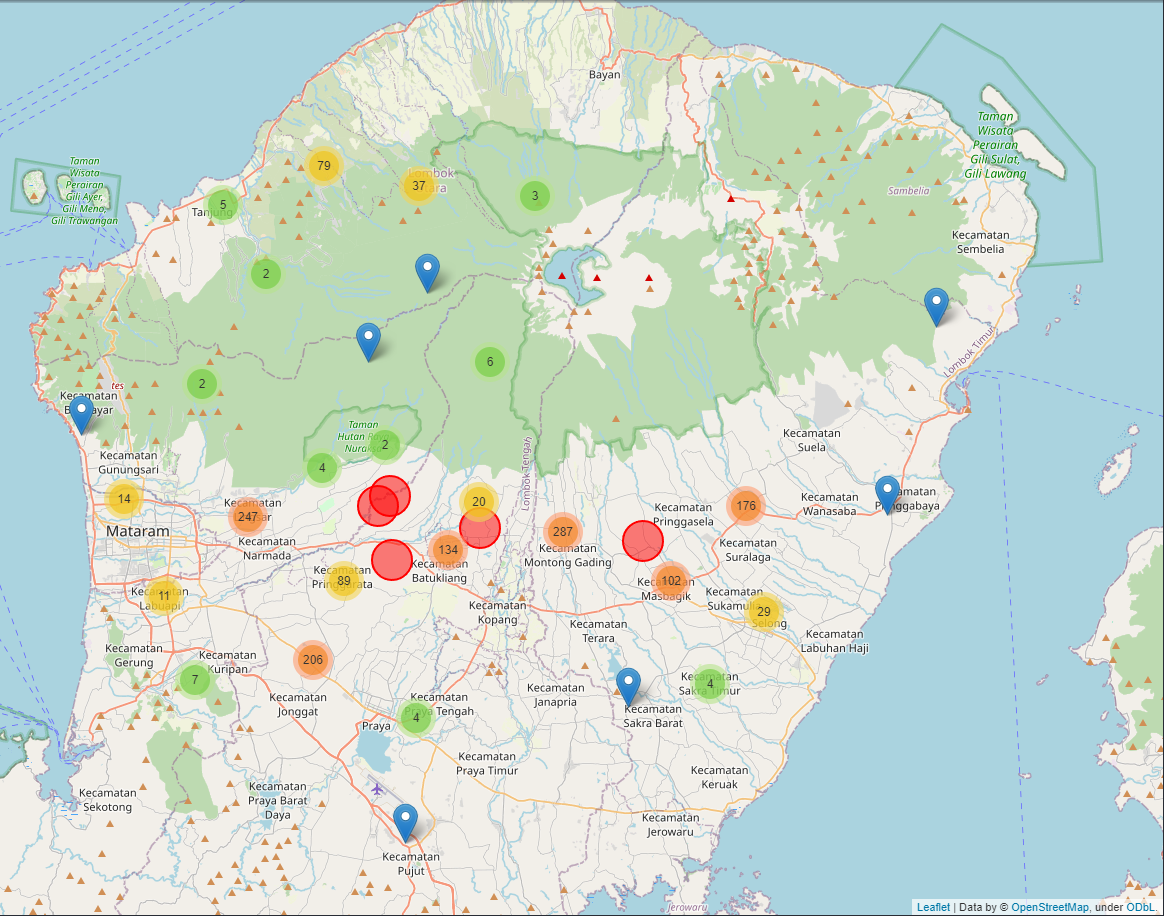
We’ll use random data that contain customers location and their transactions.
province_name = "NUSA TENGGARA BARAT"
root_path = ''

result_geocode = gpd.read_parquet(f"{root_path}/data/result_geocode_far.parquet")
far_agg_trx = pd.read_parquet(f"{root_path}/data/far_agg_trx.parquet")
| lead_id | latitude | longitude | geometry | |
|---|---|---|---|---|
| 0 | 514t | -8.57234 | 116.167 | POINT (116.1668752 -8.572337) |
| 1 | 514s | -8.56938 | 116.186 | POINT (116.185747 -8.5693771) |
| 2 | 514r | -8.66817 | 116.226 | POINT (116.2262158 -8.6681697) |
| 3 | 514p | -8.56225 | 116.168 | POINT (116.1676489 -8.5622545) |
| 4 | 514m | -8.57234 | 116.167 | POINT (116.1668752 -8.572337) |
| lead_id | highest_product_kg | total_kg | |
|---|---|---|---|
| 1606 | 5128 | 150 | 150 |
| 1607 | 5128 | 420 | 870 |
| 1608 | 5128 | 10500 | 10650 |
| 1609 | 5128 | 150 | 150 |
| 1610 | 5128 | 10500 | 10650 |
The Code
By calling clustering.cluster_core, we can calculate clustering for givin dataset.
merge_1 = pd.merge(result_geocode, farmers_agg_trx, on = "lead_id", how = "left")

model_1,labels_1 = clustering.cluster_core(merge_1[['latitude','longitude']],
                                            types='kmeans',k=5,result=True,context=False)
This function requires the following parameters:
- main_data (
string): Data location and value - types (
string): type of clustering - k (
int): Targated cluster number
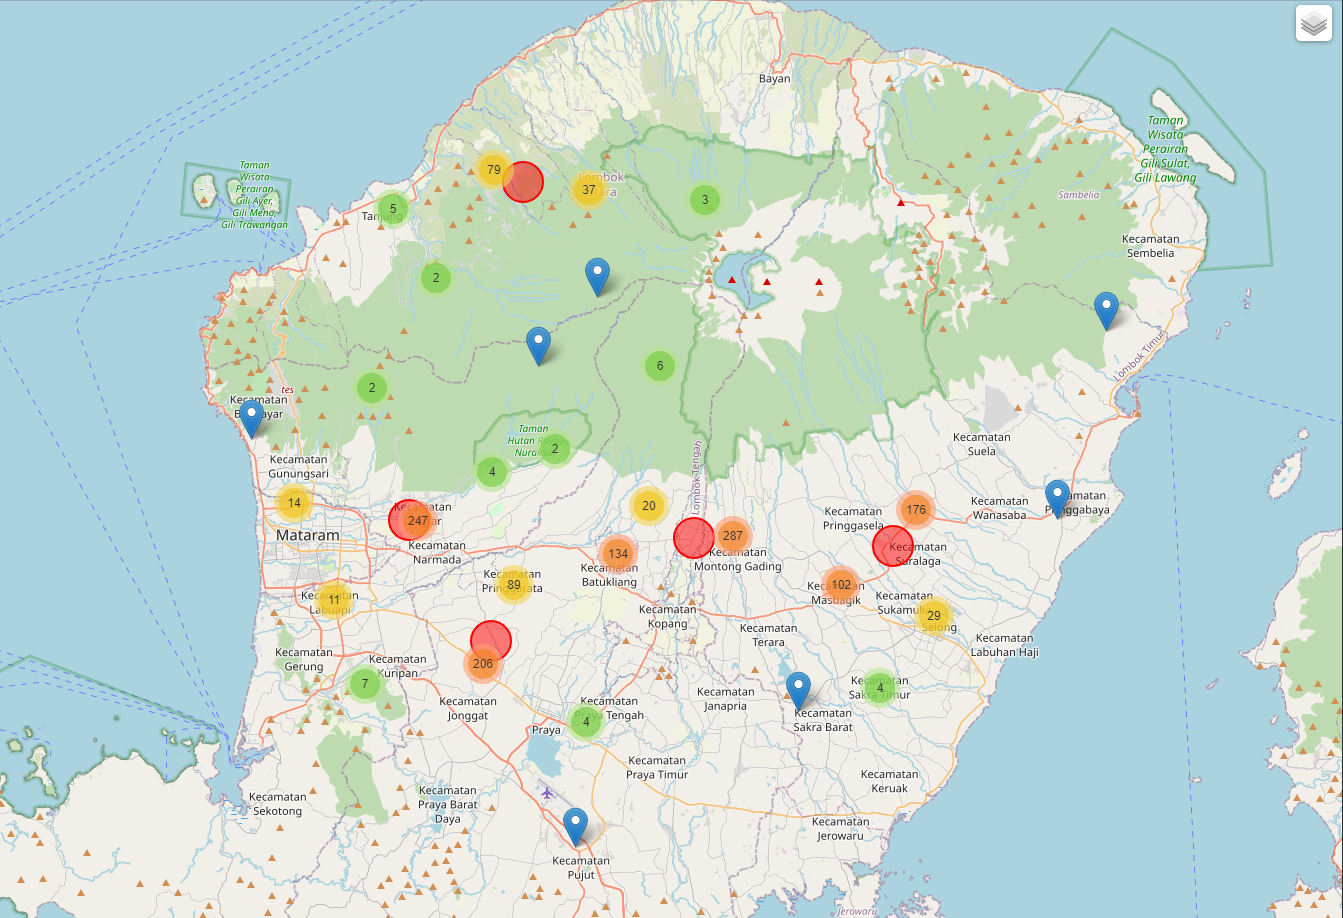
The result